As your IT infrastructure grows, it becomes increasingly important to be able to identify where bottlenecks, performance problems, or outages are occurring so that you can quickly act to fix any issues. Identifying the source of a problem can be a bit tricky once you have grown into having multiple apps, servers, and databases—but there are tools that can significantly ease your burden in locating where an issue has arisen.
The Problem: Identifying the Source
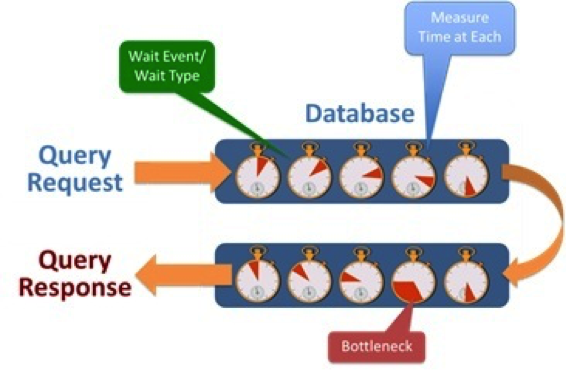
The end user experience is affected when services are not functioning properly. Source: http://logicalread.solarwinds.com/response-time-analysis/#.VWNncfm4TIU
Often, IT infrastructure begins on a small scale. Perhaps you start with a single app that runs on a single server with one small database. At this point, it is usually fairly easy to determine if that server is down, since everything will simply stop working. If it is simply the database itself, the app will most likely return errors connecting to the database.
At this level, you likely won’t feel any urgent need to set up a more robust form of monitoring. After all, there are only so many things that can go wrong. However, as your services grow, managing those services in an efficient manner becomes increasingly important.


Once you begin having multiple apps, servers, or databases, you will find that keeping track of issues becomes more time-consuming and difficult, since it may not always be clear what part of the system is failing. For example, if you have two apps using the same database server and both are not responsive, you will need to determine whether both app servers are down or the single database server is down. This could require checking in several different places to ensure you identify the correct cause.
The Solution: Using a Monitoring Service to Manage Your Services
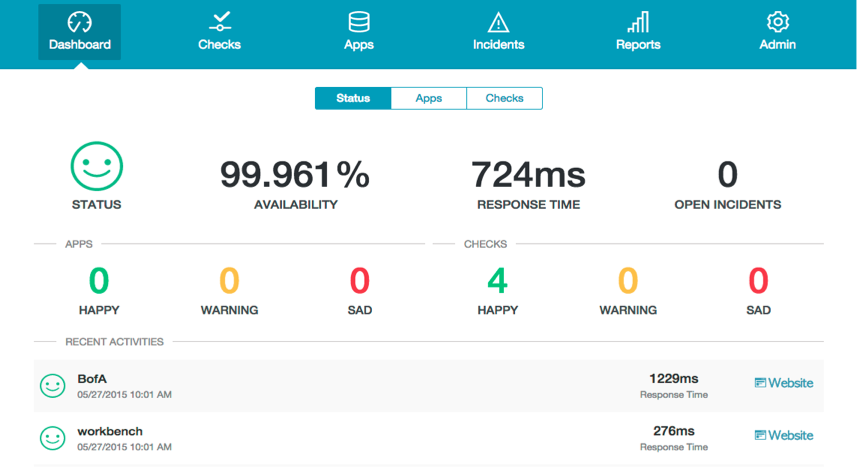
A monitoring service can quickly show you if you have any problems. Source: http://www.happyapps.io
Time to resolution is important when diagnosing and fixing any downtime for your services. You can save yourself quite a bit of time by having your various services monitored. A monitoring service cannot only send you alerts when things go wrong, but can specify which service is misbehaving or down.
For instance, if your database server has crashed for some reason, you are alerted immediately and know exactly where to go to fix the issue. If you have multiple database servers, this is even more valuable, since you will know which one it is without looking at each server until you find the one that is in error.
With a monitoring service like Happy Apps, you also get to tailor the alerts to suit your needs most effectively. You can choose to have notifications arrive by e-mail, text messages, or push notifications to your mobile device. You can also limit your alerts if needed, so that you receive only messages when there is a critical issue as opposed to something being temporarily slower than normal. Incidents are automatically opened whenever a check fails, and once all checks in an incident are passing, the incident will automatically become closed. You can always drill down to a specific incident and view the details (i.e. issues, history, and members), and Happy Apps tracks your incidents so you can understand how you fixed previous problems if the incident were to arise again.
So, why not setup your services with Happy Apps? The configuration process, often a time-consuming challenge, is made incredibly easy with Happy Apps: with just a few clicks and less than 60 seconds Happy Apps checks are watching your services. Furthermore, in DevOps style, there is an API to add checks as well. The time you save yourself in identifying where problems are occurring will make you and your end users happy!